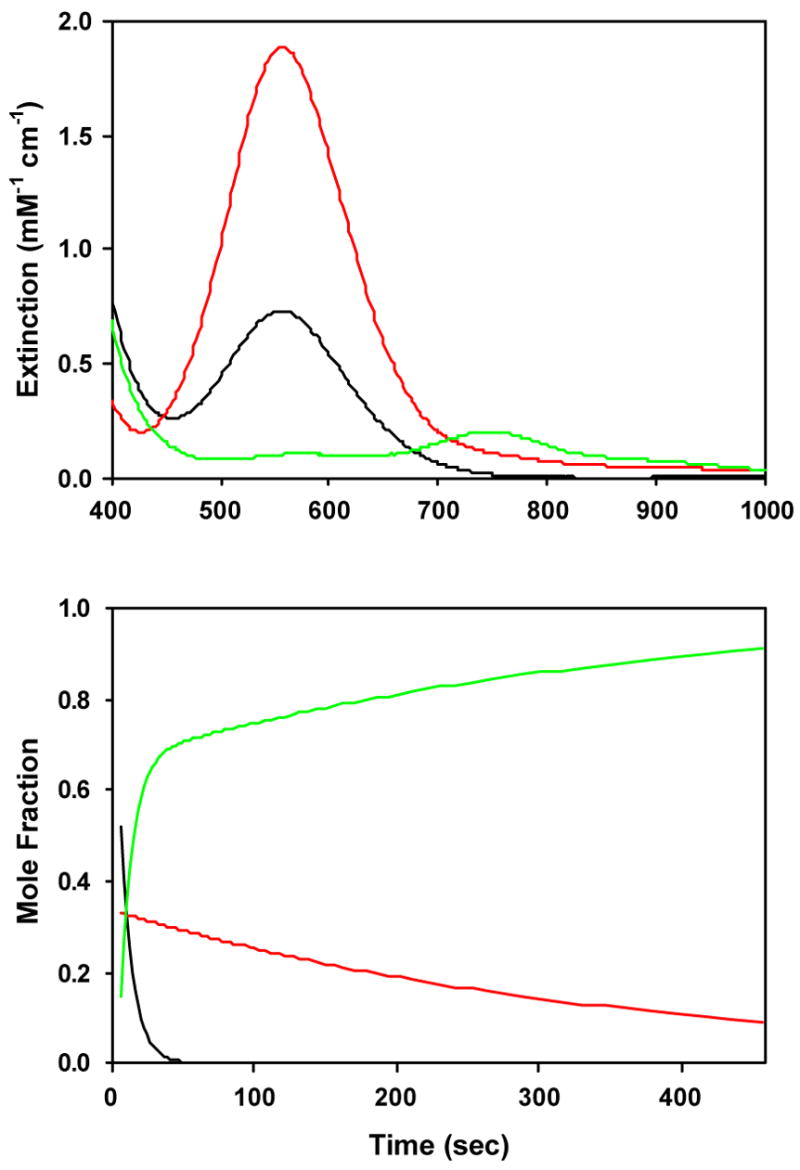
Figure 3.

Calculated spectra (top) and time-dependent concentrations (bottom) for an A (red) → C (green), B (blue) → C (green) kinetic model applied to time-dependent optical data shown in Figure 1 for conversion of 5-Me3TPA-supported alkylperoxoiron(III) to oxoiron(IV) in acetone at 228K, with initial mole fractions arbitrarily set to [A]0 = 0.52, [B]0 = 0.33, [C]0 = 0.15.
