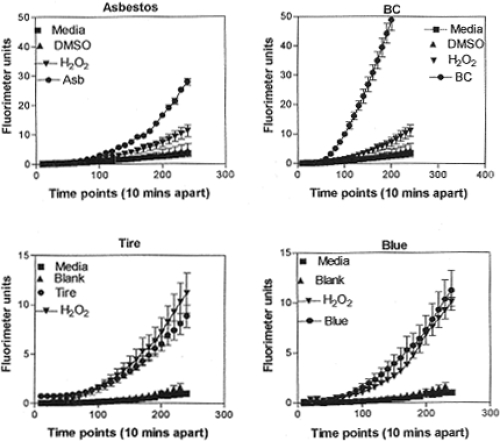
Figure 7.
Examples of ROS generation of A549 cells. Media-treated cells and H2O2-treated cells were used as negative and positive controls, respectively and DMSO-treated cells functioned as a vehicle control. Presence of ROS was determined by the relative increase in fluorescence over time as shown. From Soto and colleagues (2008). Data are presented as the mean ± SEM of quadruplicate wells and are one of three representative experiments.

