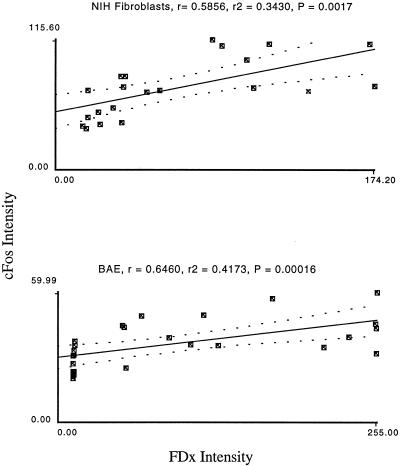
Figure 2.
Fos immunostaining intensity is quantitatively related to membrane disruption severity in the cell population lining denuded substratum. Depicted are typical plots of fos immunostaining intensities as a function of PMD extent (FDx Intensity) in an injured monolayer of NIH fibroblast cells and of BAE cells. For each plot, the linear regression coefficient R, R2, and an ANOVA p value are given. This last value tests the null hypothesis that the two parameters are not significantly related.

