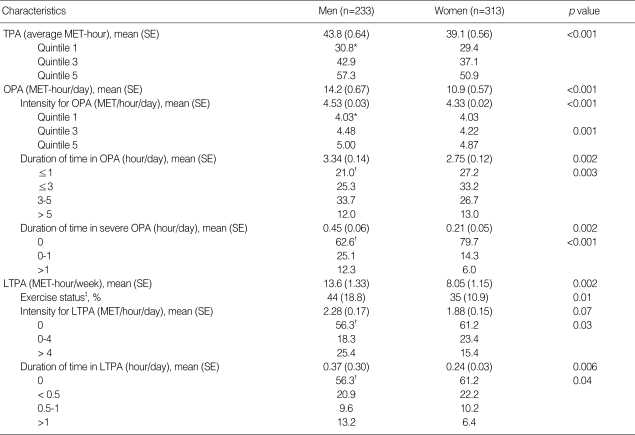
Table 3.
The distribution of subjects by the type of physical activity
All values are age-adjusted.
*, Median value; †, percentage; ‡, proportion of subjects with an LTPA score ≥22.5 MET-hours/week.
TPA, total physical activity; SE, standard error; OPA, occupational physical activity; LTPA, leisure time physical activity; MET, metabolic equivalent.

