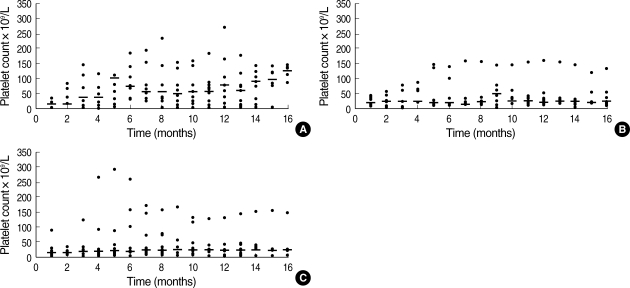
Fig. 2.
Distribution of serial platelet counts after treatment. Changes in the absolute value and median value at differential time points were measured. Serial platelet counts after therapy in the EI group (A), in the EA group (B) and in the IA group (C). -, Median platelet count at each time point.

