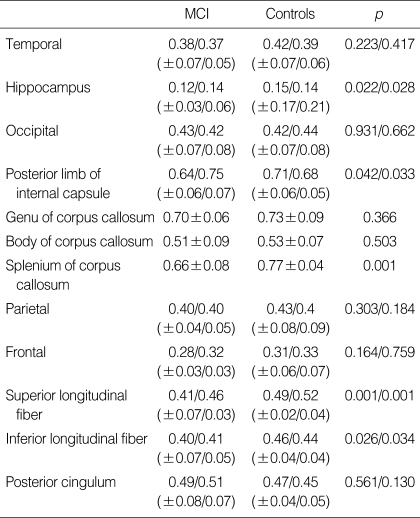
Table 3.
Fractional anisotrophy values of the selected white matter areas from MCI and controls
The data presented for the left/right hemispheres where applicable. The values are presented as means (±standard deviation).
p values are calculated by the Wilcoxon rank sum test with a p value of <0.05 indicating significance.
MCI, mild cognitive impairment.

