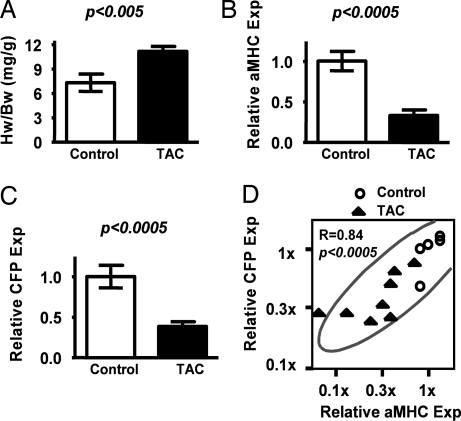
Fig. 2.
Induction of aMHC-CFP transgene expression during hypertrophy. (A–C) Comparisons of HW/BW ratios (A) and mRNA expressions relative to mean of control (Relative Exp) for aMHC (B) and CFP (C) from hearts of TAC (filled bars) and control animals (open bars). Quantitative gene expressions were determined by Taqman Real-Time PCR. (D) Bivariate analyses between mRNA levels of the relative expression of CFP (Relative CFP Exp) and aMHC (Relative aMHC Exp). Circles denote control animals (n = 6), and solid triangles represent TAC animals (4-week treatment, n = 9). The scales of both axes are logarithmic.

