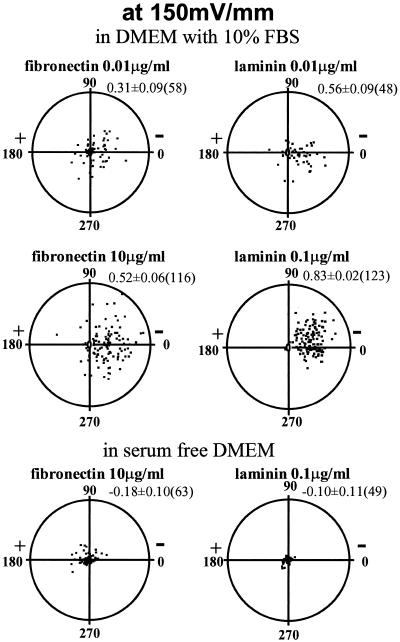
Figure 1.
Typical translocation of bovine CECs over 5 h in EF (150 mV/mm). Substrate and serum dependency are illustrated. Each point represents a single cell, located initially (0 h) at the center of the circular graph with final location plotted after 5 h in EF. The radius of each circle is 200 μm, and average cell length is ∼20 μm. The average cosine (directedness) of the distribution ± SEM and the number of cells plotted are indicated at upper right of each distribution. (for distributions for unstimulated cells and cells exposed to EF alone, see Zhao et al., 1996a).

