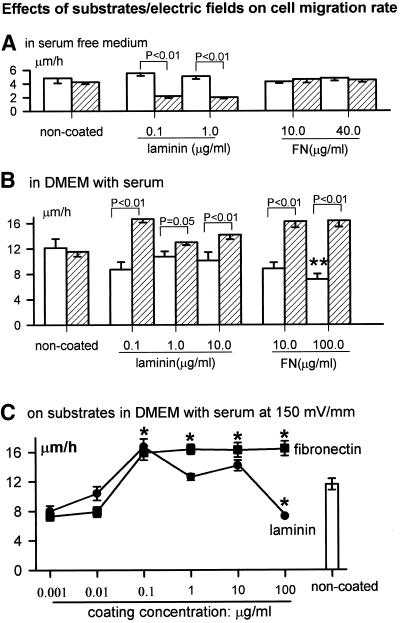
Figure 3.
Migration rate of CECs cultured in: serum-free DMEM (A) without EF (□) and with EF at 150 mV/mm (▨) and DMEM plus 10% FBS (B) without EF (□) and with EFs at 150 mV/mm (▨). **, p < 0.01 compared with that on the noncoated substratum without EF. (C) Coating concentration dependency of migration rate in serum-containing DMEM at 150 mV/mm. *, p < 0.05 compared with noncoated substratum in same EFs (shown at right). Number of cells for each point, 38∼221.

