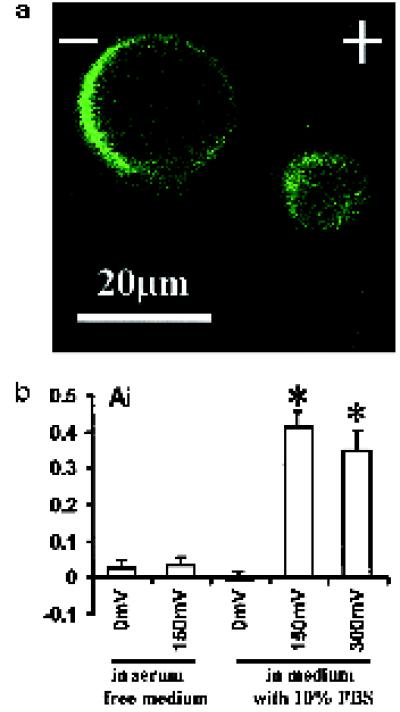
Figure 7.
Marked cathodal accumulation of EGFR on live CECs revealed by fluorescein EGF binding. (A) Cells were exposed to EF for 3 h at 150 mV/mm and labeled as described in MATERIALS AND METHODS. (B) Ai of EGFR (in 10–20 cells for each group) as revealed by fluorescein EGF binding (see MATERIALS AND METHODS for details). An Ai value >0 indicates higher fluorescence intensity on the cathodal facing side; values close to 1 indicate extreme cathodal asymmetry of EGFR. *, p < 0.001 when compared with that of the cells in serum-free medium or cells not exposed to EF.

