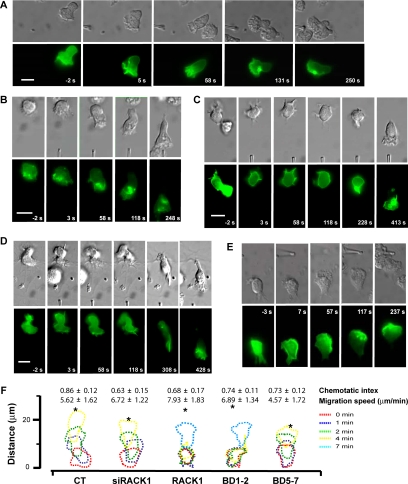
Figure 10.
RACK1 regulates migration of dHL60 cells toward a point source of fMLP. (A–E) Time-lapse images of dHL60 cell migration toward a point source of fMLP. dHL60 cells were transfected with PH-AKT-GFP together with a control (A), RACK1 siRNA (B), RACK1 (C), BD1–2 (D), or BD5–7 (E). The migration of cells imaged by Nomarski microscopy (top panel) and the spatial localization of PH-AKT-GFP (bottom panel) at the indicated times before and after fMLP stimulation are shown. Time-lapse videos of these cells are shown in the Supplemental Material. Bar, 10 μm. (F) Outlines of dHL60 cells responding to stimulation of fMLP (10 μM) delivered by a micropipette. Each set of outlines represents the migration path of a single cell from each transfection condition at the indicated time intervals after exposure to fMLP. Asterisks (*) indicate the location of stimuli. The chemotactic index and migration speed of the corresponding transfected cells calculated from multiple experiments are also shown. For cells expressing RACK1 and BD1–2, the chemotactic index and migration speed were calculated after the beginning of directional migration. Data are expressed as the mean ± SEM.

