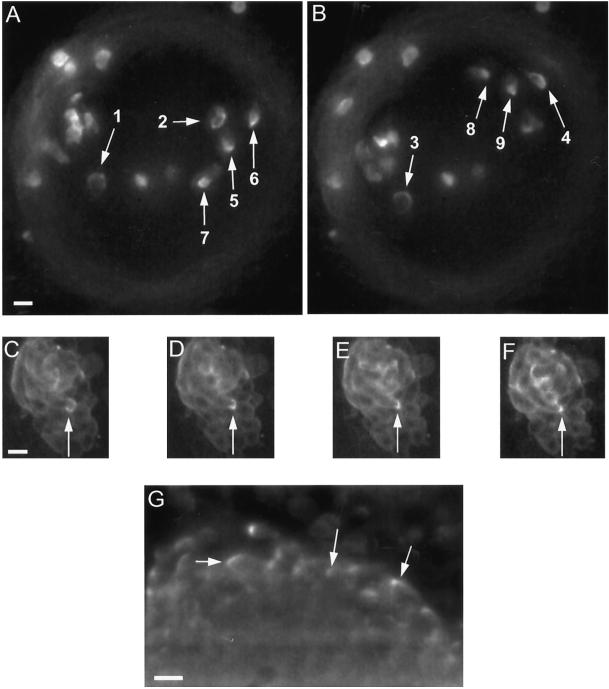
Figure 1.
Examples of the C-to-spot transition of myosin II at the cell rear. (A and B) Sampling of C-to-spot patterns in GFP-MHC cells seeded into a mound of unlabeled cells. In this mound, a number of cells undergoing counterclockwise rotation exhibit Cs (arrows 1–4), Cs condensing to a spot (arrows 5 and 6) and spots (arrows 7–9). Assignment of Cs and spots are based on movie data incorporating these images, and in each case showing the full transition from a C to a spot (See online movies or the author’s website as listed in ACKNOWLEDGEMENTS.) Each view is a projection of three focal planes spanning a total depth of 20 μm. The time interval from A to B is 280 s. The mound edge is defined by the dim gray ring. (C–F) Sequence of the C-to-spot transition in an individual cell (arrows), showing the initial C (C), the C condensing to a spot (D and E), and the spot (F). Images are from the same focal plane obtained 100 s apart. This tight mound is composed entirely of GFP-MHC cells undergoing clockwise rotation. (G) Control demonstrating Cs and spot patterns in a mound fixed and stained for immunofluorescence using an anti-myosin II mAb. Shown is one focal plane slice from a 3D image stack that was deconvolved to reduce out-of-focus light. Bars, 10 μm.

