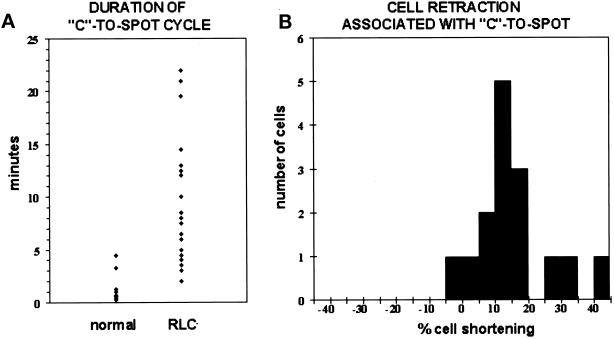
Figure 3.
C-to-spot statistics. (A) The conversion from a C to a spot is on average slower in RLC− cells. Dots represent the duration of a C-to-spot conversion for a particular cell in the mound as measured from time-lapse images recorded at intervals ranging from 1 to 60 s, depending on the experiment. Only cells that remained in focus throughout the entire C-to-spot conversion were selected for these measurements. Duration of the C-to-spot was determined by measuring the time interval between the first appearance of a C through the condensation into a spot at the cell rear. Normal on the left represents nine GFP-MHC cells in five different mounds. RLC− on the right represents 23 RLC− cells with GFP-MHC in 10 different mounds. (B) The conversion of a C to a spot is normally associated with cell retraction. To determine percent cell shortening, cell length was measured at the beginning of a C and then at the end of the cycle when a full spot had formed. Percent shortening was calculated by subtracting the cell length at the spot stage from the cell length at the C stage and then normalizing this difference by cell length at the C stage. Negative values therefore represent an increase in cell length. Again, only cells that remained in focus throughout the entire C-to-spot conversion were selected for these measurements. Fifteen cells are represented in six different mounds; 14 of these cells shortened when a spot formed.

