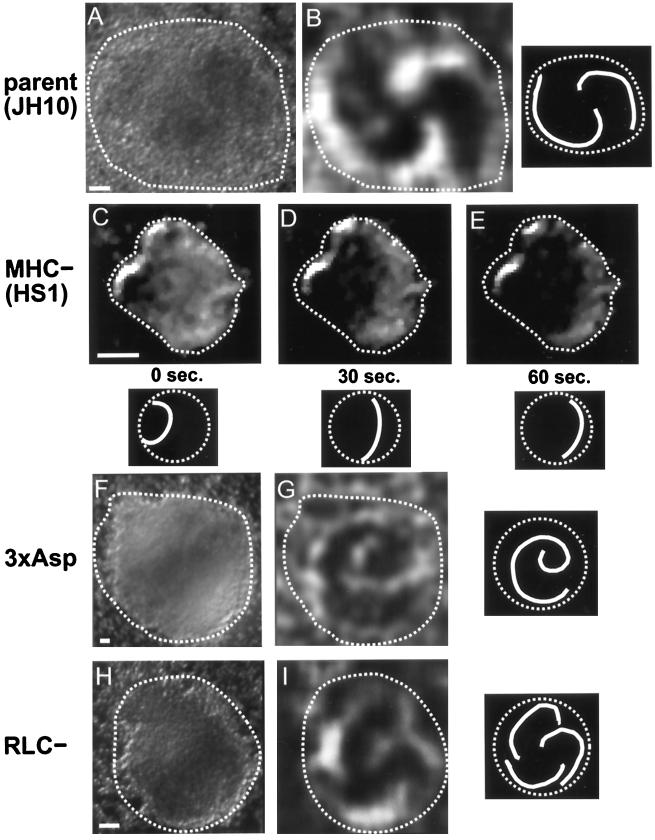
Figure 5.
Dark-field waves in parent and mutant mounds. Wave patterns are most easily visualized in movies available online or at the author’s web site listed in ACKNOWLEDGMENTS. The still-frame images shown here have been image enhanced to help highlight the wave front. Adjacent to each wave image is a schematic of the wave pattern. The dashed line in the schematic indicates the mound periphery, and the solid line indicates the wave front. (A) Dark-field image of parent strain (JH10) mound. The wave pattern is not visible in a still-frame image but can be seen when a time sequence of such images is played in rapid succession, as available online. (B) Two-armed spiral wave from the same mound as in A, but after subtraction of time points 30 s apart to enhance the differences between the two images and thereby highlight the moving wave front (which in this case rotates counterclockwise). (C–E) Aberrant waves in an MHC− mound. Instead of producing a clear wave front, these mutant mounds tended to form a dark zone that propagated, in this case from left to right, into a light zone. Wave centers tended to be at the edge of the mound (leftmost edge in this mound) and were transient, with new centers eventually arising elsewhere near the mound periphery. (F) Dark-field image of 3xAsp mound. (G) Apparently normal wave in a 3xAsp mound displaying a single dominant center about which a one-armed spiral wave rotates. The image is the same mound as in F but after subtraction of time points 90 s apart to enhance the wave profiles. (This one-armed spiral wave rotates clockwise.) (H) Dark-field image of an RLC− mound. (I) Apparently normal wave in an RLC− mound displaying a single dominant center about which a three-armed spiral wave rotates. The image is the same mound as in H but after subtraction of time points 30 s apart. (This rotates counterclockwise.) Bars, 40 μm.

