Figure 4.
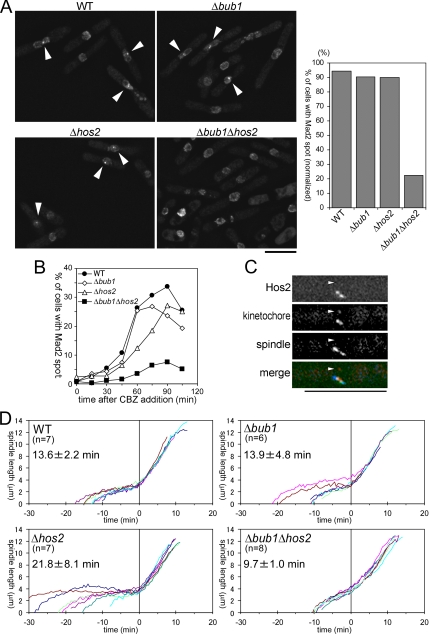
Δbub1 Δhos2 double gene deletion impairs accumulation of Mad2 on unattached kinetochores. (A) Cells with the indicated genotype were treated with CBZ after S phase synchronization. Details are described in the text. Images of Mad2-GFP in these cells are shown, and bright Mad2 spots are indicated by arrowheads. Bar, 10 μm. Calculated percentages of cells with the Mad2 spot in the mitotic population are presented in the right panel. (B) Percentages of cells with Mad2 spot in total cells were counted every 15 min after addition of CBZ. More than 250 cells were examined for each sample. Cells were presynchronized in S phase as described in the text. (C) Snapshot of an nda3 mutant cell expressing Hos2-YFP, Mis12-Cherry (a kinetochore component) and CFP-Atb2 (α-tubulin) after recovery from mitotic arrest. Nine serial Z-sections with an interval of 0.3 μm were flattened after deconvolution. The position of the kinetochore detached from the spindle is indicated by an arrowhead. In the merged panel, Hos2-YFP, Mis12-Cherry, and CFP-Atb2 are pseudocolored green, red, and blue, respectively. Bar, 10 μm. (D) Spindle lengths from multiple movies of exponentially growing cells with the indicated genotype were analyzed. Cells were cultured in minimal medium at 26°C, and Pcp1-CFP (SPB marker) was used to determine the length. The time point at which phase 3 spindle extension began was defined as 0. The number of samples examined (n) and average time required for phase 1 + 2 (average ± SD) in each strain are shown.

