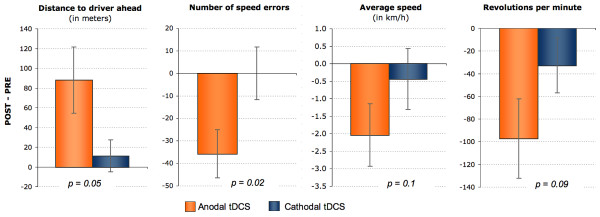
Figure 1.
Differences between anodal and cathodal tDCS. Depicted are differences and standard errors (SE) between pre- and post-stimulation driving behavior (POST minus PRE) pooled across the two experimental groups (left DLPFC and right DLPFC stimulation). The p-values indicate the significances of the 'time × condition' interactions for each of the four behavioral variables.

