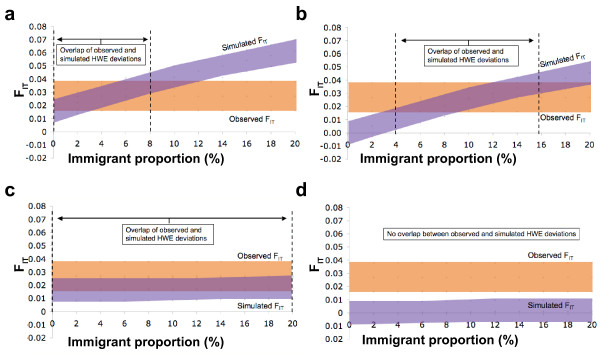
Figure 4.
Simulations of genotyping error and hidden population structure in Sweden. The simulated effect of genotyping error and hidden population structure on the total fixation index Findividual/country (FIT) and the number of markers deviating from HWE in the Swedish data. The 95% confidence bounds are based on 1,000 simulations. A) Non-random error and non-European substructure, B) random error and non-European substructure, C) non-random error and European substructure, D) random error and European substructure.

