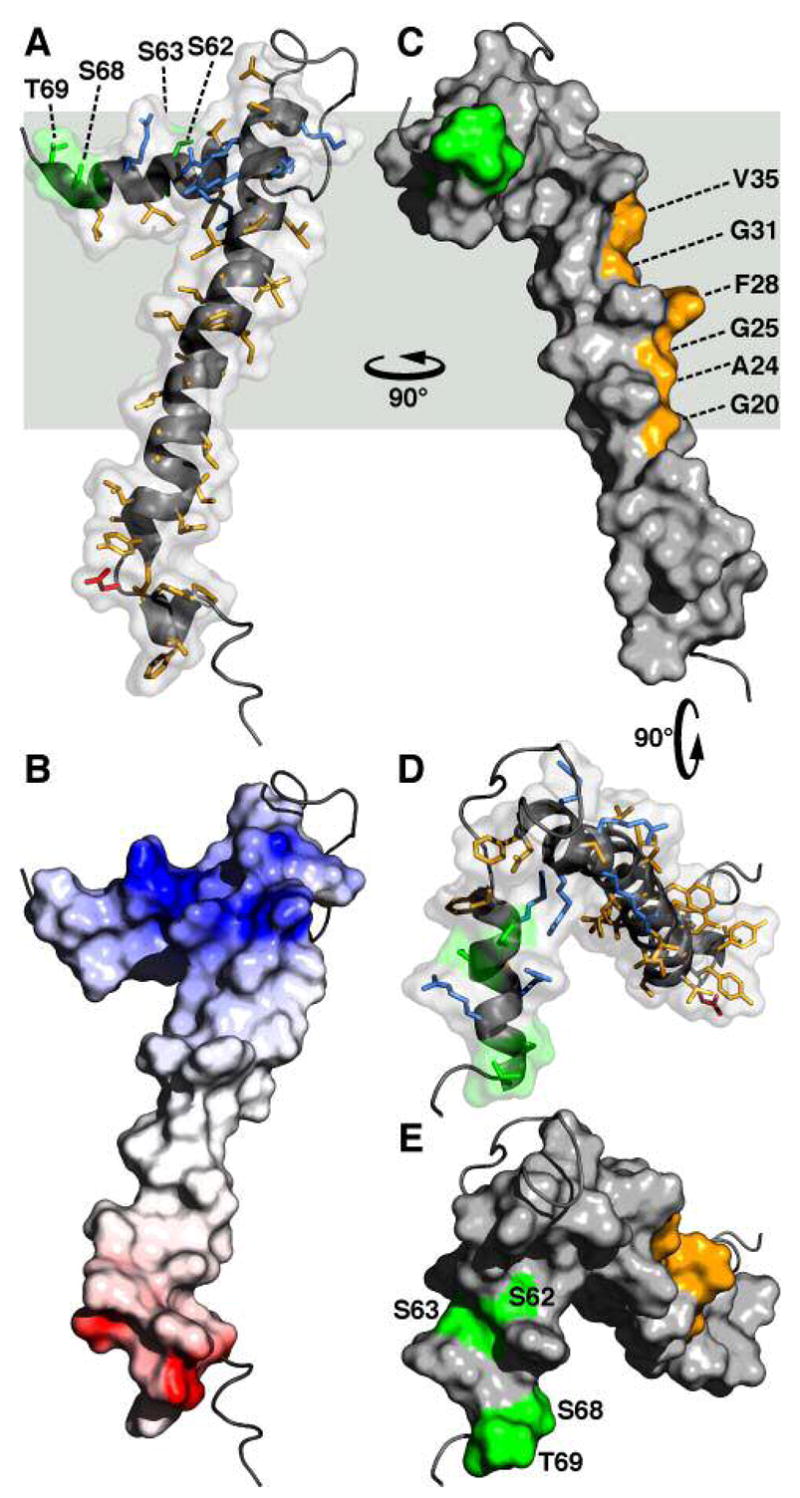
Figure 6.

Molecular backbone and surface representations of FXYD1. (A, D) In the helical regions, basic side-chains are shown in blue, acidic side-chains are red, and apolar side-chains are yellow. The three Ser residues (S62, S63, S68) and Thr69 in the cytoplasmic helix are in green. (B) The surface is color coded with regions of electrostatic potential <−8kBT in red, and regions of electrostatic potential >+8kBT in blue, where kB is the Boltzmann constant and T is the temperature. (C) The structure is viewed 90° around the membrane Y axis from (A, B). Residues in the transmembrane helix (G20, A24, G25, F28, G31, V35), predicted to interact with the Na,K-ATPase α subunit are shown in yellow. (D, E) The structures are viewed down the membrane surface from the cytoplasm, 90° around the membrane X axis from (C). The structure has been deposited in the databank (PDB accession code: 2JOL).
