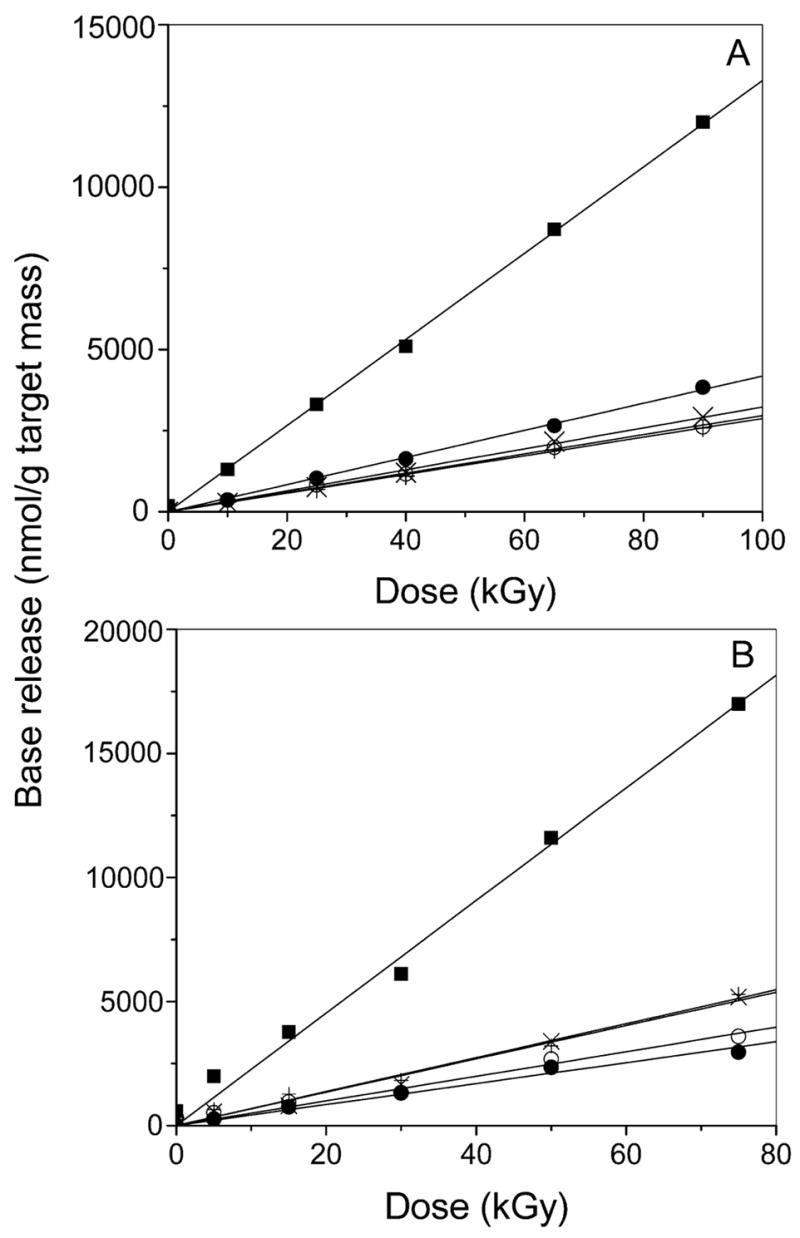
FIG. 2.

Dose–response curves for the release of cytosine (●), guanine (○), thymine (×), adenine (+), and total free base (■) from X-irradiated pUC18 films at room temperature under Γ = 2.5 (panel A) and Γ = 22.5 (panel B). The solid line shows the linear least-squares fit to the data for ≤ 90 kGy. Note that here free base release is plotted using the target mass, i.e., the mass of DNA plus its solvent shell, as in our previous work (13).
