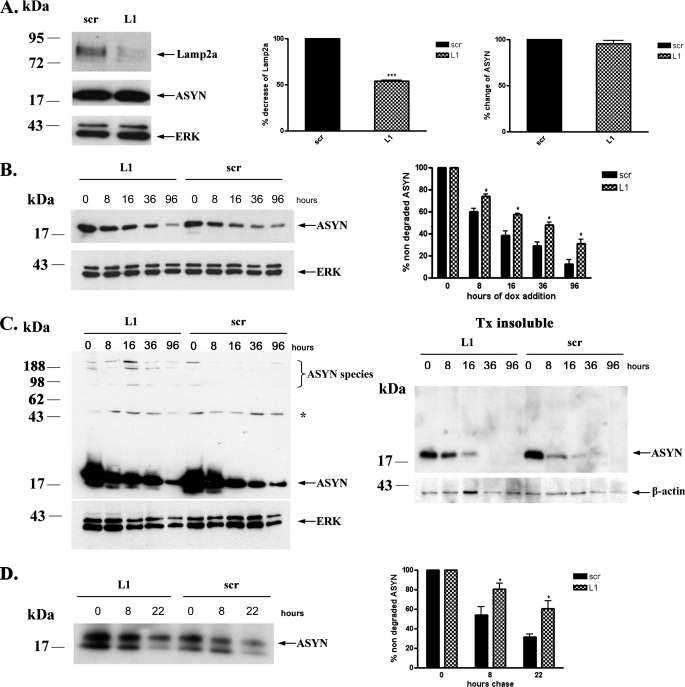
FIGURE 2.
Down-regulation of Lamp2a in PC12 cells leads to slower turnover of WT ASYN. A, transient transfection of rat Lamp2a siRNA (L1), effectively down-regulates endogenous Lamp2a but has no effect on the steady state levels of overexpressed WT ASYN. PC12 cells expressing WT ASYN were cultured in the absence of dox for 5 days and then were transiently transfected with L1 or scr siRNA. 48 h later, cells were lysed and assayed for ASYN and Lamp2a. Left, representative immunoblot of Lamp2a and ASYN. Middle and right, quantification of Lamp2a (middle) and ASYN (right) levels in cells transfected with L1 compared with cells transfected with scr siRNA. Results are expressed as the ratio to OD values of the corresponding controls, and data are presented as mean of + S.E. of 9 (for Lamp2a) and 6 (ASYN) independent experiments. B–D, WT ASYN displays a slower turnover rate in cells transfected with L1 compared with cells transfected with scr siRNA. B, WT ASYN cells were cultured without dox for 5 days and next transfected with L1 or scr siRNA, and 48 h later dox was added. At successive time points after dox addition, cells were examined for ASYN levels by immunoblotting. Left, representative immunoblot of ASYN. Right, quantification of turnover rate of WT ASYN after dox addition. C, WT ASYN cells were treated as in B and examined for ASYN levels by immunoblotting. Left panel, the detergent (Triton X-100 (Tx))-soluble L1 or scr siRNA-treated samples were run on 4–12% BisTris NuPAGE gels and assayed by Western blot for ASYN and ERK (loading control). High molecular weight ASYN species in the Lamp2a down-regulated (L1)-treated samples are indicated by a brace. The asterisk indicates an irrelevant band. Right panel, the detergent-insoluble pellets from the L1 or scr siRNA-treated samples were solubilized in SDS sample buffer, run on 12% gel, and assayed by Western blot for ASYN and β-actin (loading control). Representative Western blots from three separate experiments are shown. D, WT ASYN cell lines were cultured in the absence of dox for 5 days. Cultures were treated with siRNAs as in B and labeled with [35S]cysteine/methionine for pulse-chase. ASYN was immunoprecipitated from hot lysates with C20 ASYN Ab, and its levels were assessed by autoradiography (indicated by the arrow). Left, representative pulse-chase is shown. Right, quantification of the turnover of WT ASYN in cells transfected with L1 or scr siRNA. All data are presented as the relative OD values of each time point relative to time point 0. The graphs represent the mean ± S.E. of three independent experiments. (*, p < 0.05; ***, p < 0.001, Student's t test comparing L1 with the control scr).

