FIGURE 6.
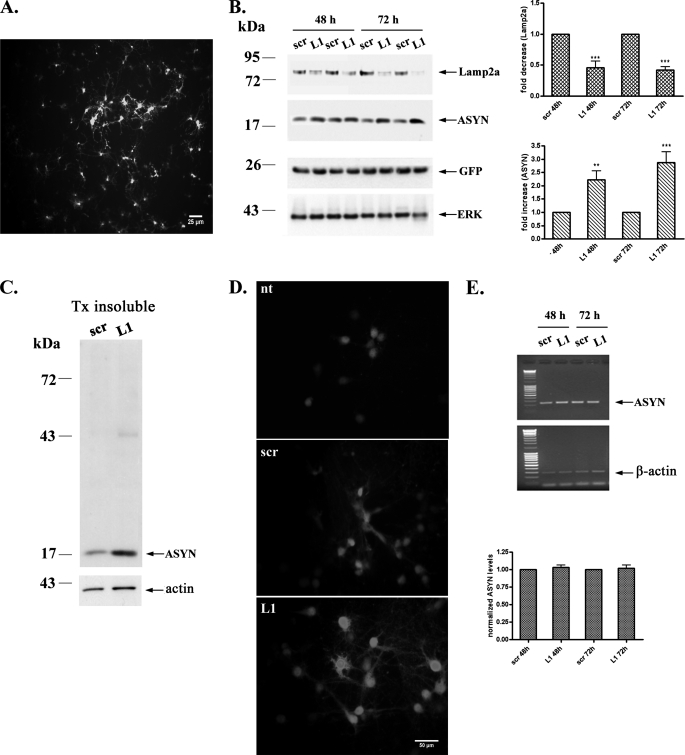
Lentiviral down-regulation of Lamp2a significantly increases endogenous ASYN protein levels in rat cortical neurons. CMA impairment via Lamp2a silencing results in endogenous ASYN accumulation. Primary rat cortical neurons were transduced with lentiviruses (m.o.i. 5) expressing Lamp2a (L1) or scr siRNA for 24 h. After 48 and 72 h, cells were assayed by Western blot for Lamp2a, ASYN, GFP (infection control), and ERK (loading control) levels. A, representative image of rat cortical neurons 72 h post-infection with the L1 lentivirus that contains a CMV-EGFP reporter cassette to monitor infection is shown. B, left, representative Western blots from 12 separate experiments are shown. Right, densitometric analysis of the levels of Lamp2a and ASYN. C, detergent (Triton X-100 (Tx)-insoluble pellets from the L1 or scr siRNA-treated samples were solubilized in SDS sample buffer and assayed by Western blot. Representative Western blots from three separate experiments are shown. D, ASYN immunostaining in rat cortical neurons 72 h post-infection with the scr or L1 lentiviruses. ASYN immunostaining in nontransduced (nt) neurons is also presented. The same microscopy settings were used in all cases. L1 infected neurons display increased ASYN immunofluorescence. No frank inclusions were observed. E, mRNA levels of ASYN are not altered following down-regulation of Lamp2a. 48 and 72 h post-infection RNA was extracted, and RT-PCR for ASYN and β-actin was performed. Representative images from three separate experiments are shown in the left panel. Densitometric analysis of the RT-PCR products, expressed as ASYN: β-actin ratio (arbitrary units), is presented in the right panel. All results are presented as the ratio to OD values of the corresponding controls, and data are presented as mean ± S.E. (**, p < 0.01; ***, p < 0.001, one way ANOVA followed by the Student-Newman-Keuls' test, comparing L1 to scr).

