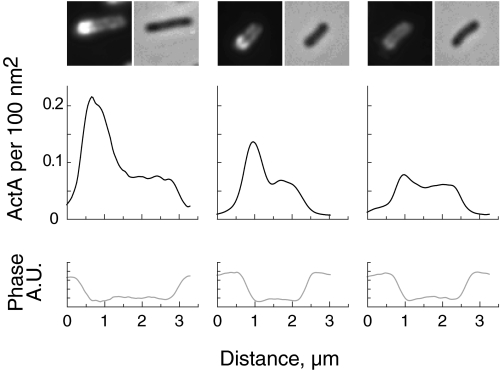
FIGURE 8.
ActA density on L. monocytogenes. 355 L. monocytogenes were used to determine the surface density of ActA. Representative images of three bacteria showing immunofluorescently labeled ActA and the corresponding phase image are shown directly above their respective line scans. Line scans measure pixel intensities through the long axis of the bacteria. The upper line scans (black) are calibrated in ActA molecules per 100 nm2 using the fluorescence image data. The lower line scans (gray), obtained from the phase image, were used for distance/size calibrations. ActA densities over the entire data set range from 0 to 0.3 ActA molecules per 100 nm2. A.U., arbitrary units.

