
Figure 5.
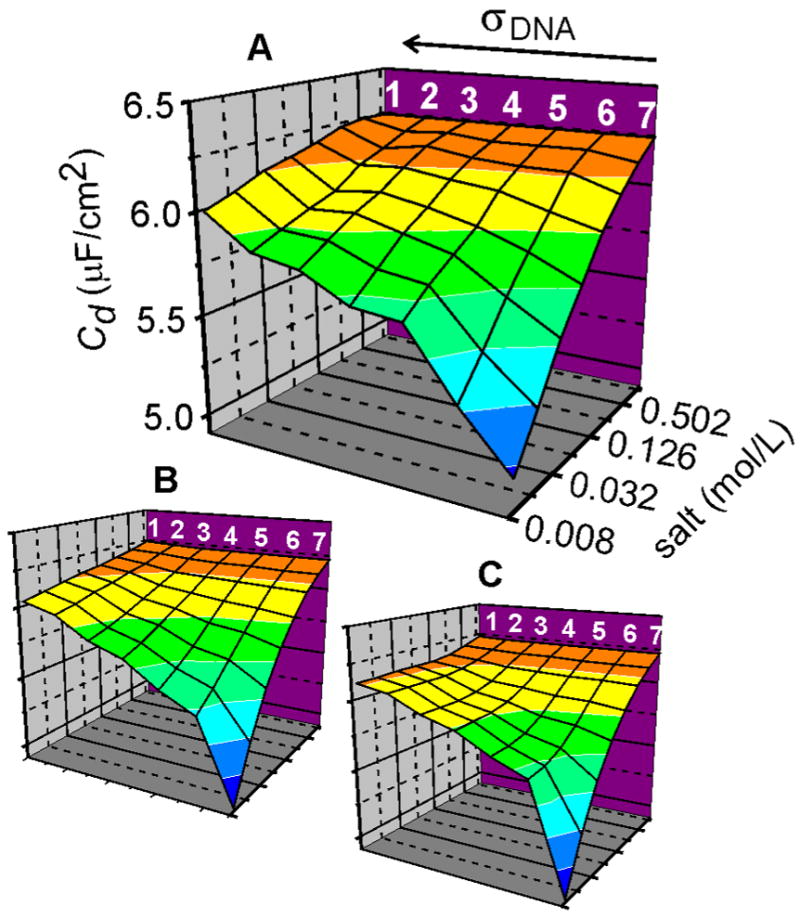
Comparison of experimental and calculated Cd values as a function of salt concentration and strand coverage. All plots are on common xyz scale, shown in (A). Strand coverages are indicated by numbers along the top of plot (A) in order of decreasing coverage: (1) 2.1 × 1013 cm−2, (2) 1.5 × 1013 cm−2, (3) 7.8 × 1012 cm−2, (4) 5.8 × 1012 cm−2, (5) 3.4 × 1012 cm−2, (6) 2.4 × 1012 cm−2, (7) pure MCP monolayer. (A) Experimental data. (B) Cd response for the RM model. w = 0.0 ± 0.17, v = 0.28 ± 0.05, Cp = 6.38 (± .03) × 10−6 F/cm2, V0 = −0.017 (± 0.006) V. Uncertainties reflect 10 % increase in rms error. (C) Cd response for the SM model. H = 10 nm, Cp = 6.38 × 10⁻⁶ F/cm2, V0 = −0.017 V. For purposes of comparison, the curve for each coverage in (A) was rescaled by a constant factor (between 0.97 and 1.06) so as to equalize Cd at 1 M with that measured for the pure MCP sample. This adjustment lies within experimental uncertainty of the roughness factor r used for area-normalization of the capacitance.