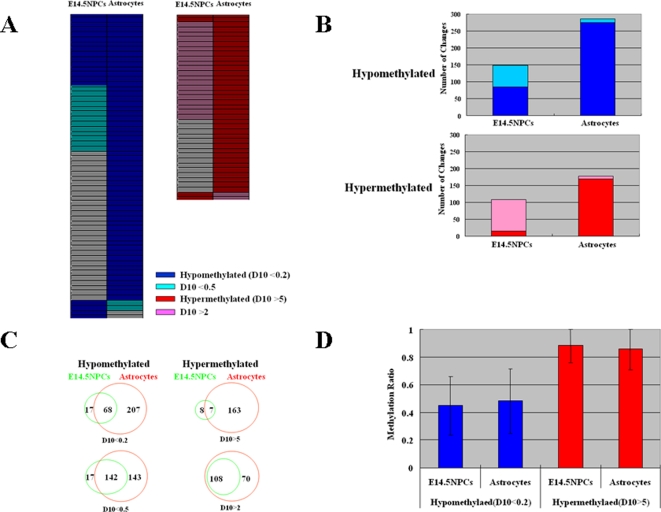
Figure 2. Genome-wide profiling of DNA methylation.
(A) Hypomethylated and hypermethylated genes in E14.5 NPCs and astrocytes compared to E11.5 NPCs. Each row indicates each probe and each column indicates E14.5 NPCs or astrocytes. Probes with methylation changes are indicated in color. D10 is a value indicating the difference between methylation-sensitive Hpa II cleavage and methylation-insensitive Msp I cleavage. (B) Number of methylation changes in E14.5 NPCs and astrocytes compared to E11.5 NPCs. Numbers of methylation changes indicated in Fig. 1A were counted and indicated by bars. (C) Venn diagram of the number of probes with methylation changes in E14.5 NPCs and astrocytes compared to E11.5 NPCs. (D) Absolute levels of DNA methylation analyzed by MIAMI presented as methylation ratio. Methylation ratios of hypermethylated and hypomethylated probes are presented as average±standard deviation.

