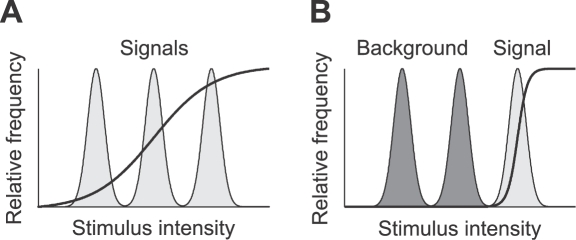
Figure 1. Optimal sigmoidal stimulus response curves (solid lines) for a stimulus distribution consisting of three peaks (shaded areas) as predicted by two coding hypotheses.
(A) Infomax: the dynamic range of the adapted response curve covers the whole range of input signals. Note that the optimal sigmoidal response curve is shown; generic optimal transmission would be attained by a response curve that has a derivative proportional to the local stimulus distribution. Such a response curve would be steep within peaks of the stimulus distribution and much flatter in between, thus it would be more staircase-like. (B) Selective coding: the response function optimally represents the most intense signal (light gray) whereas other signals (dark gray) are suppressed.

