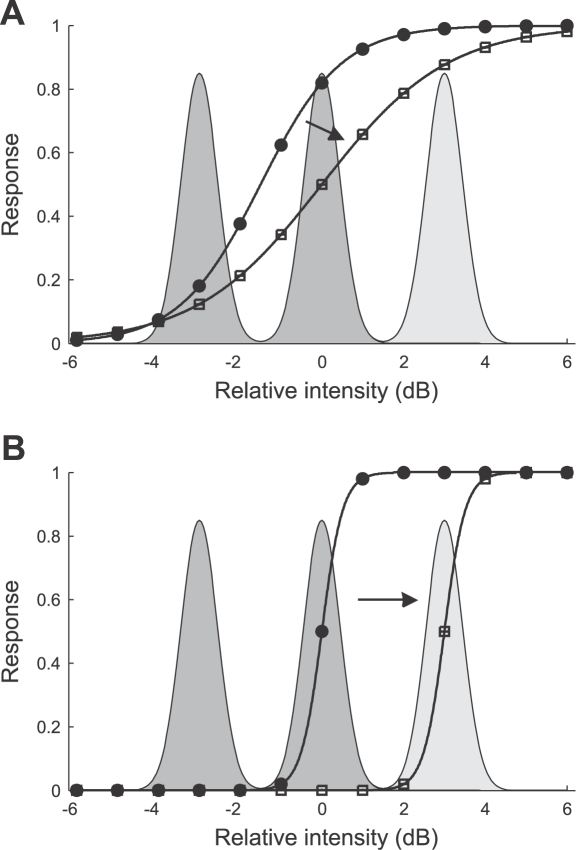
Figure 8. Optimal response curves for the bimodal (circles) and trimodal (squares) stimulus distribution predicted by the infomax principle (A) and the selective coding hypothesis (B).
The figures show the predicted relationship between the response variable (spike rate) and the stimulus intensity. The Gaussian curves depict the probability distributions of stimulus intensity, where the dark shaded areas under the curve denote the bimodal stimulus distribution and the light shaded area under the curve the additional peak of the trimodal stimulus distribution (cf. Figure 1).

