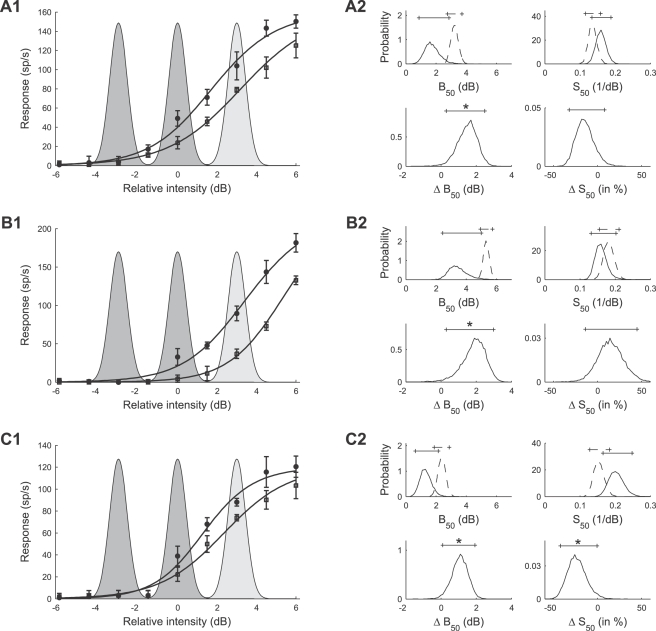
Figure 10. Typical examples of stimulus response curves after adaptation to the bimodal and to the trimodal stimulus distributions (A1,B1,C1) and posterior densities of the corresponding response curve parameters (A2,B2,C2).
(A1,A2,C1,C2) Results for AN2 cells of T. leo. (B1,B2) Results for an AN2 cell of a T. oceanicus. (A1,B1,C1) Circles and squares denote the mean spike counts in a 200 ms time window of the test stimulus after adaptation to the bimodal and trimodal distributions, measured for 9 different relative intensities of the test stimulus (cf. protocol of Figure 3C). Error bars denote the standard deviation. Solid lines indicate the expected response curve, i.e., the response curve with the set of parameters with the mean value of the posterior distribution (see Methods, Bayesian data analysis). The shaded areas depict the intensity distribution of the stimuli (dark: bimodal stimulus distribution, light: additional peak of the trimodal stimulus distribution). (A2,B2,C2) Marginal posterior densities (cf. Methods, Bayesian data analysis) of the response curve parameters B 50 (location) and S 50 (slope). The posterior densities after adaptation to the bimodal (solid lines) and trimodal (dotted lines) stimulus distributions are shown in the top panels and the corresponding posterior densities of the changes (ΔB 50, ΔS 50) between stimulus conditions in the bottom panels. Solid (dotted) lines on top of the figures depict the 95% posterior intervals. Significant changes between stimulus conditions are indicated by a star.

