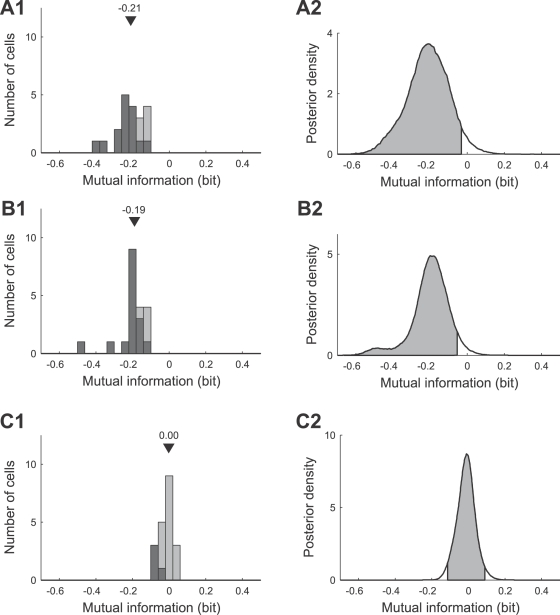
Figure 13. Adaptation induced changes in the mutual information between the stimulus and the neural response.
(A1,A2) Distribution and combined posterior density of changes in the transmitted mutual information when considering the whole stimulus range (relative intensity from −4.5 dB to 4.5 dB) and the trimodal amplitude distribution. For each cell the change of the mutual information is calculated as the difference of the mutual information for the ‘trimodal’ (neural response adapted to the trimodal stimulus) and the ‘bimodal’ (neural response adapted to the bimodal stimulus) response curve. The distribution in (A1) is based on the mean values of changes in mutual information for individual cells. (B1,B2) Distribution and combined posterior density of changes in the transmitted mutual information when considering the stimulus range from −4.5 dB to 1.5 dB (including only the two low-intensity peaks of the trimodal stimulus distribution). (C1,C2) Distribution and combined posterior density of changes in the transmitted mutual information when considering the stimulus range from 1.5 dB to 4.5 dB (including only the high-intensity peak of the trimodal stimulus distribution). Triangles denote the median value. The distribution of cells that showed changes that were significant (Bayesian posterior intervals, Methods, Bayesian data analysis) is marked black in (A1,B1,C1). Shaded areas depict the left-tailed 95% posterior intervals in (A2,B2) and the two-tailed 95% posterior interval in (C2).

