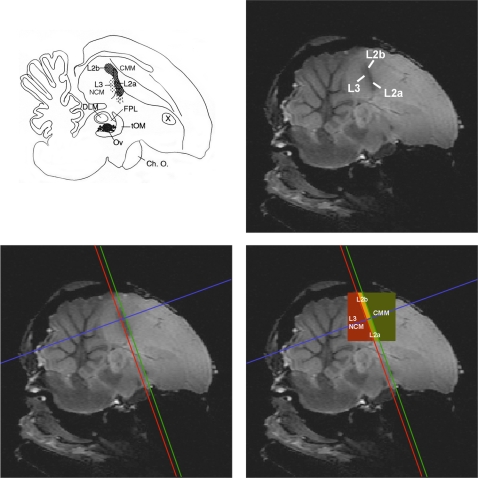
Figure 3. Visualisation of Field L2 on high resolution T2-weighted SE images and regional analysis (see online edition for color figure).
The figure displays how the subfields L2a and L2b in the study of Vates et al. [46] compare to the core of the darker ellipsoid region of our anatomical high resolution MR images that corresponds to the dense fibre track that defines sub-region L2. (Schematic illustration adapted from Vates et al. [46]; anatomical MR image from Poirier et al. [50]). By drawing lines rostral and caudal from L2, and a third perpendicular line, regional analysis could be performed in a caudal/ventral region that comprises L3 and NCM, a rostral/dorsal region that comprises CMM, a dorsal region that comprises L2b and a ventral region that comprises L2a. ABBREVIATIONS, Ch. O. = Optic Chiasm; CMM = caudal medial mesopallium; DLM = medial nucleus of the dorsolateral thalamus; FPL = lateral forebrain bundle; L2a, L2b, L3 = sub-regions of Field L; NCM = caudomedial nidopallium; Ov = nucleus ovoidalis; tOM = tractus occipitomesencephalicus; X = area X.

