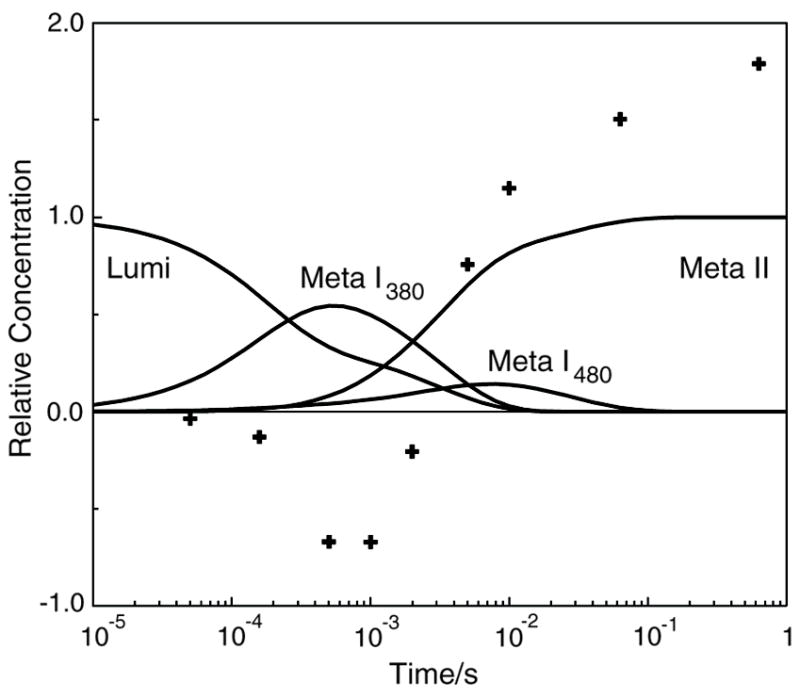
Figure 5.

Time dependence of the concentration of photointermediates and proton release seen after photolysis of rhodopsin mutant E122Q. Curves show the relative concentration of photointermediates that appear after photolysis and points (+) show proton changes associated with the pigment after photolysis. The proton uptake data show release of at least one proton per photolyzed rhodopsin at the Meta I380 stage followed by more than 1 proton per rhodopsin uptake at Meta II.
