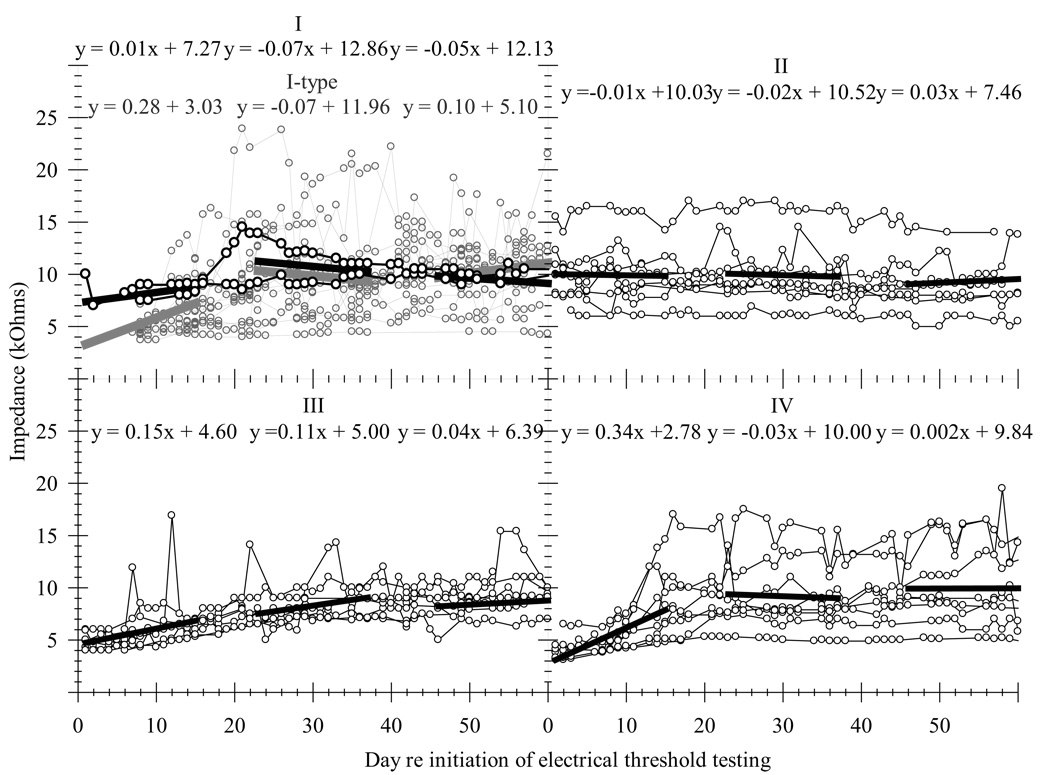
Fig. 3.
Impedance measured with a 1 kHz sinusoidal signal at 1 µA rms for all groups as a function of time re initiation of electrical threshold testing. Each panel corresponds to the data from one group, each function represents one subject and each point represents one impedance measurement. Group I (black) and “Group-I-type” (gray) subjects were chemically deafened and then implanted on the same day (during the same surgery) and began electrical threshold testing the day after surgery. Group II subjects were chemically deafened and then implanted on the same day (during the same surgery) and began electrical threshold testing 45 days after surgery. Group III subjects were chemically deafened in one surgery, implanted in a separate surgery 45 days later and began electrical threshold testing the day after implantation. Group IV subjects were implanted only (they were not chemically deafened) and began electrical threshold testing the day after surgery. Each solid thick line represents linear regressions for the collective data from each group for the early (days 1 – 15), middle (days 23 – 37) and late (days 46 – 60) time periods and reported above each regression is its corresponding equation.

