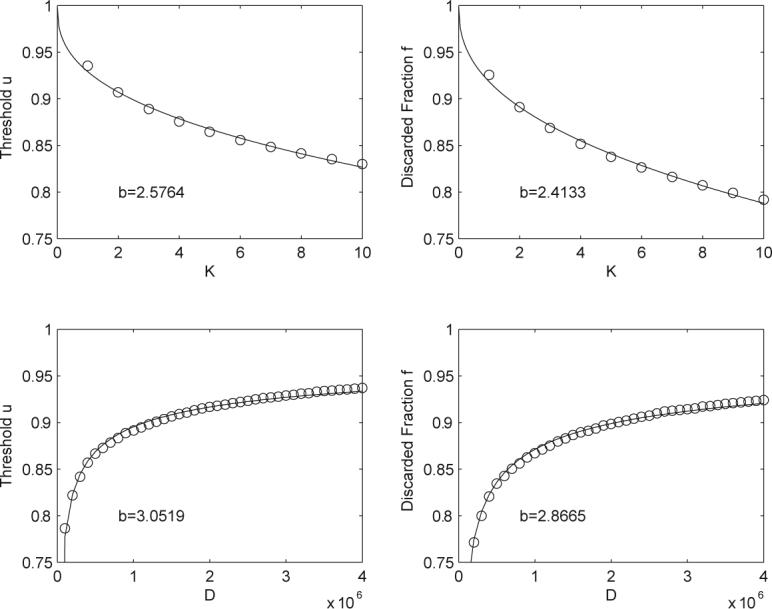
Figure 11.

The two upper plots correspond to an experiment where K is varied and |D| is held constant at 4,099,792. Results are averaged over 5,000 separate queries randomly chosen from the ChemDB. The two lower plots correspond to an experiment where |D| is varied and K is held constant at 1, the data is averaged over 1,000 separate queries randomly chosen from ChemDB. The lines are the best fit curves using the functional form given by y = 1 − C(K/|D|)1/b, where b and C are the fit parameters and y corresponds either to u or the fraction pruned from the database. This equation fits the data very closely with similar values for b. One can notice a small, but systematic, misfit between the empirical points and the theoretical curve y = 1 − C(K/|D|)1/b. This can be entirely eliminated by introducing one additional offset parameter and fitting y = 1 − [C1 + C2(K/|D|)1/b] to the data.
