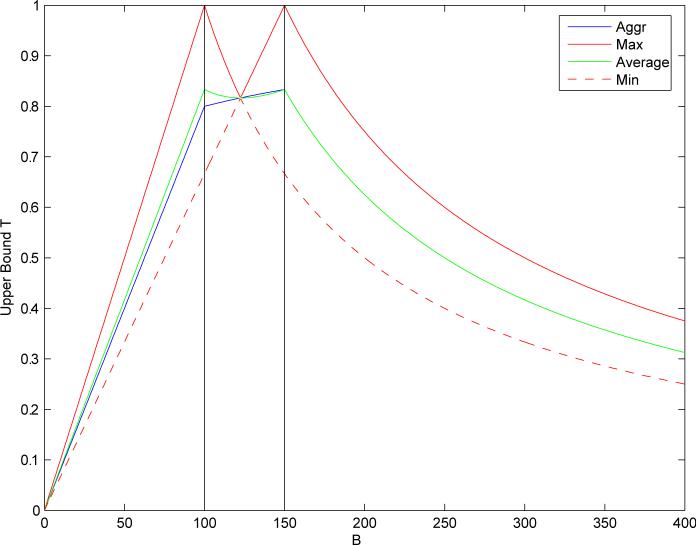
Figure 5.
Bounds T on similarity measures as a function of the size B of the binary fingerprint of a molecule in the database. Two-molecule query with A1 = 100 and A2 = 150. Each curve corresponds to a different similarity measure. Average (green) is the average Tanimoto similarity across the two molecules in the query. Min (red dashed) [resp. Max (red)] is the minimum (resp. maximum) of the Tanimoto similarities. Aggregate (blue) is the aggregation of the individual Tanimoto similarity measures (Equation 12 with αi = βi = 1 and wi = 0.5 for all i).

