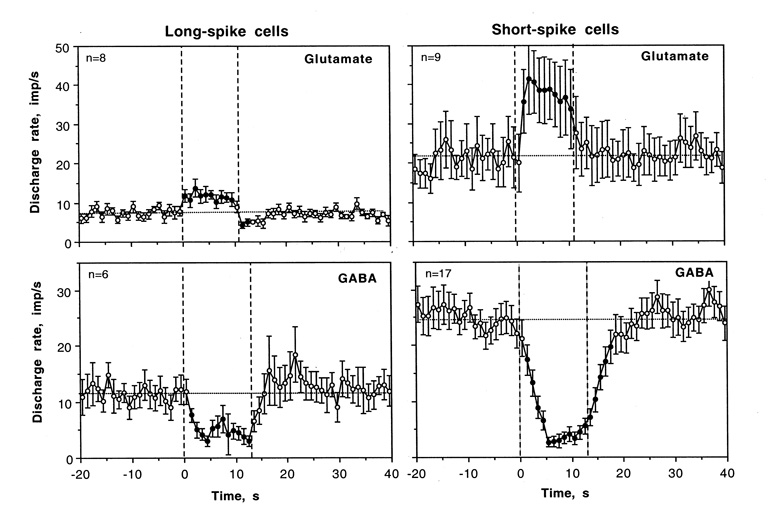
Fig. 11.
Averaged responses of long-spike (LS) and short-spike (SS) VTA neurons to GLU and GABA ejected at the same small currents (10±5 nA). Each graph shows changes in discharge rate before, during (two vertical hatched line) and after iontophoretic application. Filled symbols show values significantly different from baseline and n shows number of responses analyzed.

