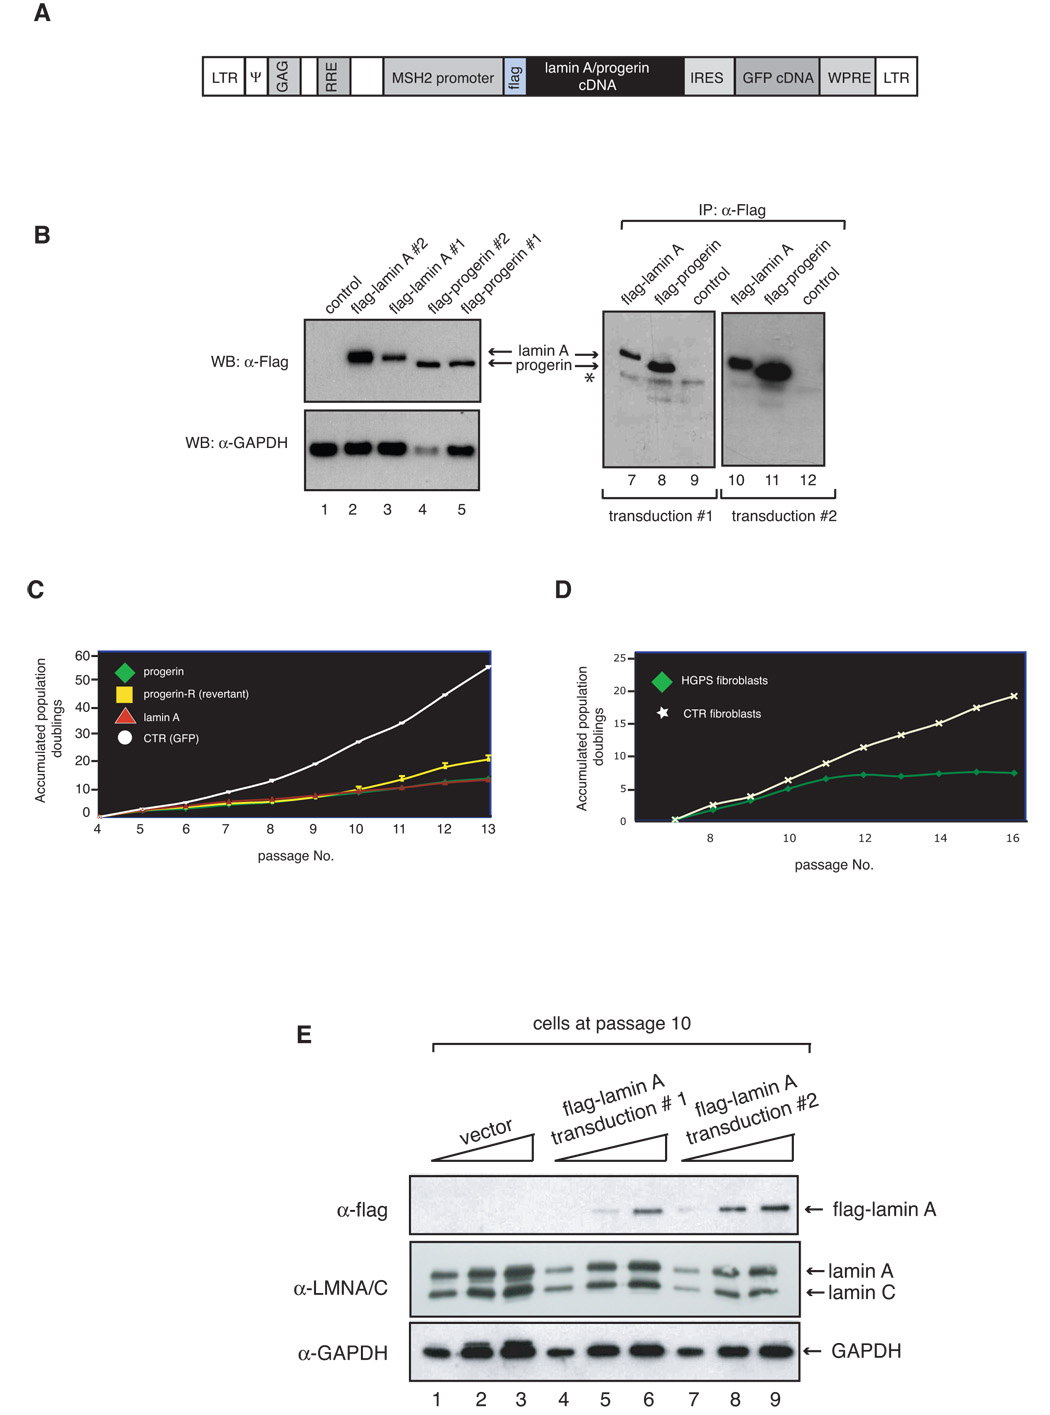
Figure 1.

Elevated levels of wild-type lamin A in normal human fibroblasts results in decreased cell growth. A. Map of the lentiviral vector used to generate the human primary fibroblast cell lines expressing wild-type flag-lamin A and flag-progerin. LTR= Long Terminal Repeats; ψ= encapsidation signal; GAG gene; RRE= Rev response element; IRES= internal ribosome entry sequence; WPRE= woodchuck hepatitis virus regulatory element. B. Cell lysates were prepared from fibroblasts transduced with lentiviruses expressing flag-lamin A (lanes 2, 3, 7 and 10), Flag-progerin (lanes 4, 5, 8 and 11), or GFP-only (lanes 1, 9 and 12), were either analyzed by SDS-PAGE, and immunoblotted with anti-flag and anti-GAPDH antibody (lanes 1–5) or subjected to anti-flag immunoprecipitation and analyzed by western blotting with flag antibody (lanes 7–12). 15 µl and 300 µl of cell lysates were used in western blot analyses and immunoprecipitation reactions, respectively. Asterisk refers to signal by IgG heavy chains. C. Growth curves of stably transduced fibroblasts are shown as accumulated population doublings. D. Growth curves of HGPS fibroblasts (AG11498) and normal fibroblasts (GM00038). Another HGPS (HGADFN003) and normal (GM00316) fibroblast lines showed a growth pattern similar to AG11498 and GM00038, respectively. E. Lamin A levels in flag-lamin A expressing cells demonstrate a small increase in lamin A when compared to control cells. Lamin A levels were measured in total protein extracts (lanes 1, 4 and 7:10 µg, lanes 2, 5 and 8: µg 20 and lanes 3, 6 and 9: 30 µg) prepared from fibroblast lines transduced with vector lentivirus or lentiviruses expressing flag-lamin A at passage 10 by western blot analysis. The levels of flag-lamin A and total lamin A were quantified and normalized to lamin C and GAPDH by Imagequant software as described in Materials and Methods.
