
Figure 8.
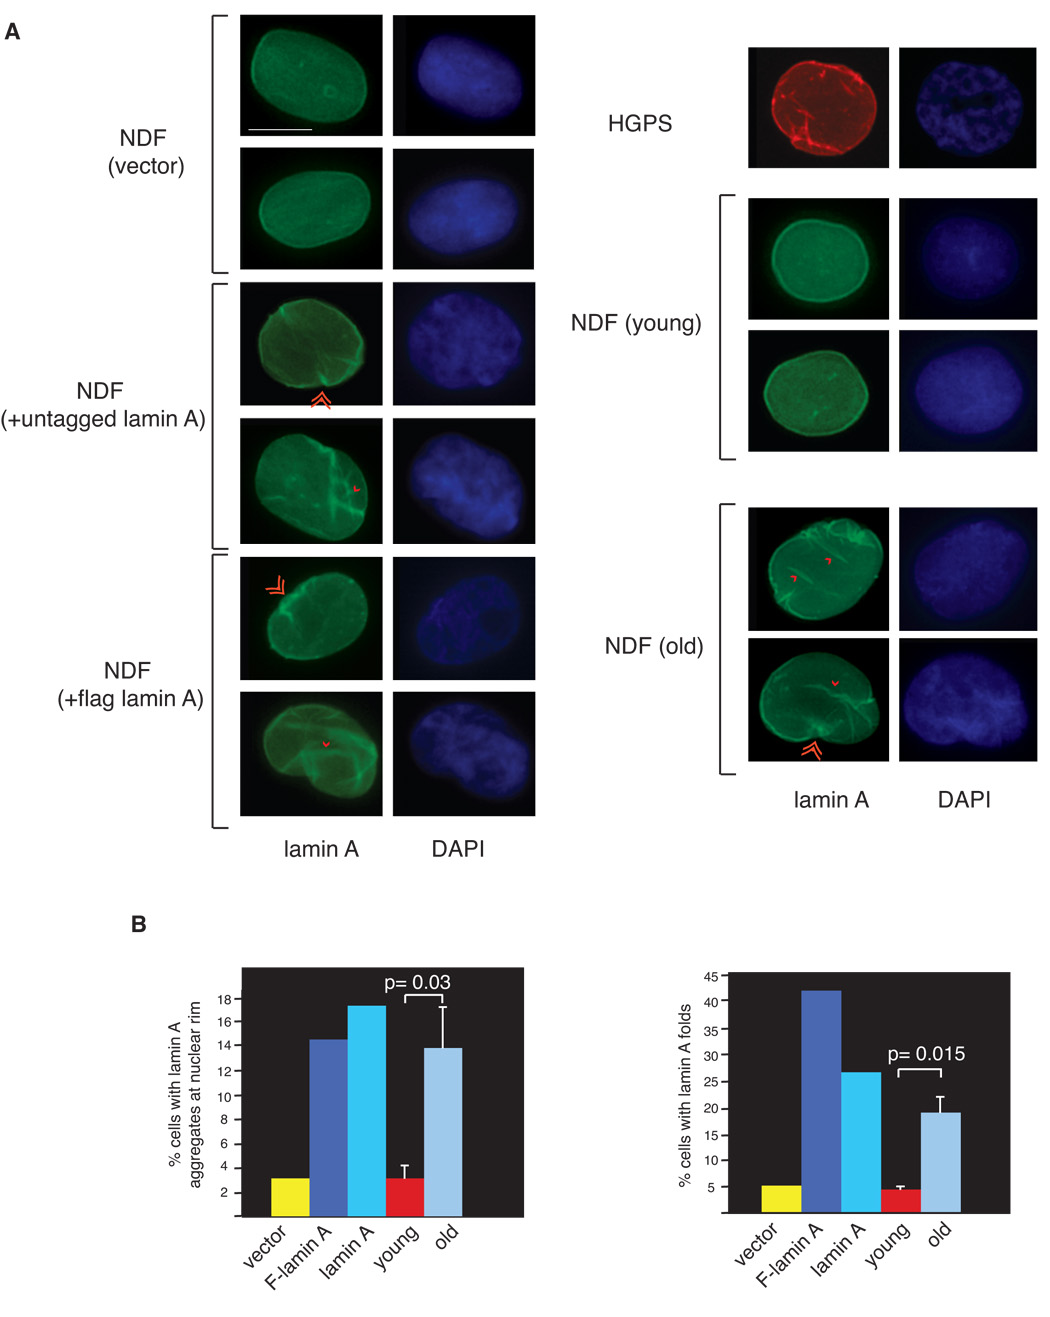
A Abnormal pattern of lamin A localization in cells expressing elevated levels of wild-type lamin A resembles that of cells from old-age individuals. Immunofluorescence microscopy on primary diploid fibroblasts transduced with control lentivirus and lentiviruses expressing either lamin A or Flag-lamin A, primary fibroblasts from young (30 y) and old (87 y) healthy individuals and fibroblasts from a HGPS patient. DAPI, 4′,6′-diamidino-2-phenylindole. Single and double arrowheads show lamin A aggregates at nuclear rim and lamin A folds, respectively. Bar: 10 µm B. Quantitation of percentage of cells (n= 300) showing either lamin A aggregates at the nuclear rim (right panel) or lamin A folds (left panel). Data for young and old age fibroblasts represent mean +/− standard deviation of analyses performed using 3 distinct cell lines from young and old healthy individuals. Statistical significance of the differences between young and old individuals was determined by a two-tailed student’s t-test.