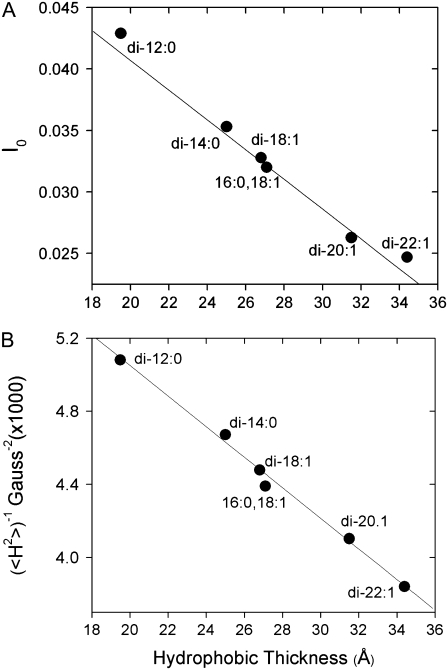
FIGURE 5.
Plots of (A) normalized amplitude, I0, and (B) second moment, 〈H2〉, obtained from EPR spectrum T156R1 reconstituted into different lipids as a function of lipid membrane hydrocarbon thickness. Data for lipid hydrocarbon thickness in the liquid crystalline phase were taken from previously published x-ray scattering data: DLPC and DiEiPC were from (34), and all other data were from (35). Errors in values of I0 and 〈H2〉 are ∼5%.

