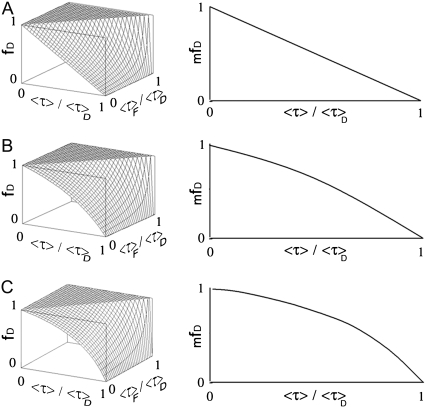
FIGURE 2.
Surface plot of fD for a multi-lifetime donor system with two species. (Left panel) fD versus 〈τ〉/〈τ〉D and 〈τ〉F/〈τ〉D using Eq. 13 for K = 1 (A), 2 (B), or 3 (C). (Right panel) corresponding mfD versus 〈τ〉/〈τ〉D related to the minimization of fD as a function of 〈τ〉F/〈τ〉D (〈τ〉F/〈τ〉D = 0). Surface and curve in panel A are lower than the surfaces and curves presented in panels B and C. It corresponds to the minimization of fD following K. For the curve in panel A (〈τ〉F/〈τ〉D = 0 and K = 1), mfD is linear as defined by Eq. 15.

