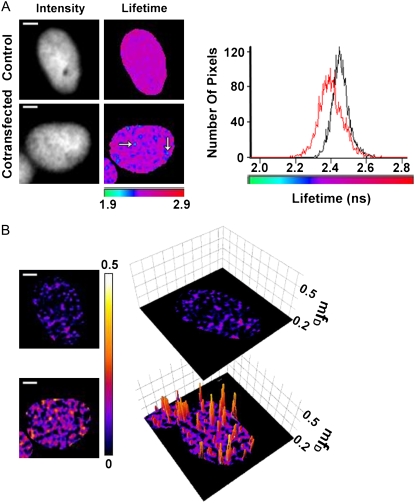
FIGURE 5.
FLIM and mfD images of GFP-BD interaction with acetylated mCherry-H4 in the nucleus of HEK293 live cells using TriM-FLIM system at fast acquisition times. (A) Intensity and FLIM images of GFP-BD expressed alone as control (upper panel) or with mCherry-H4 as cotransfection (lower panel) in HEK293 live cells using the TriM-FLIM system at 950 nm excitation and 535AF45 emission filter with five time-gated images. Intensity images were obtained by summing the time-gated stack. FLIM images were obtained by using Eq. 2 in a pixel-by-pixel manner. The corresponding lifetime histograms are presented in the right panel (black for control and red for cotransfection). White arrows show two chromatin domains in which GFP-BD mean lifetime decreases significantly. The mean lifetime averaged throughout the nucleus decreased from 2.45 ns for the control to 2.40 ns for the cotransfection. Scale bar = 2 μm. (B) (Left panel) mfD images of control and cotransfection obtained by using Eq. 6 with τD = 2.45 ns. (Right panel) Three-dimensional representation of the corresponding mfD images using a threshold limit given by the control (0.2). Scale bar = 2 μm.

