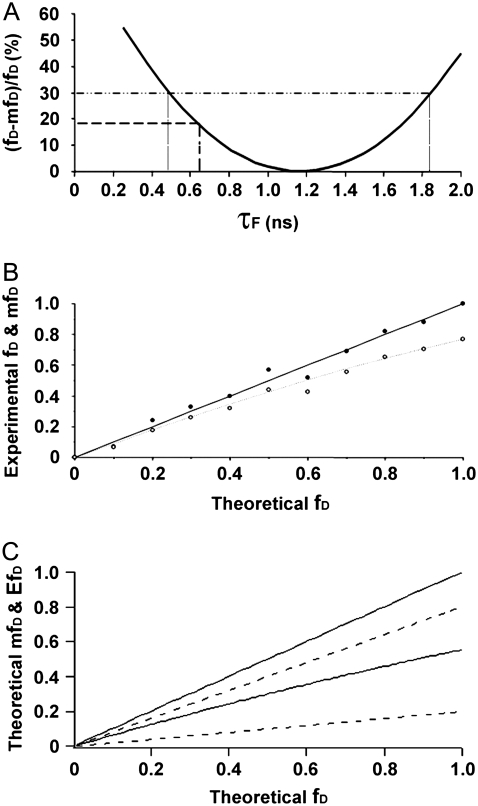
FIGURE 7.
The mfD behavior as a function of τF and fD. (A) Underestimation of fD by mfD as a function of τF for GFP-BD interaction with acetylated mCherry-H4 (11 time-gated experiments). Equations 5 and 6 were used, fixing the value of τD = 2.41 ns and 〈τ〉 = 2.34 ns. The dashed line placed at τF = 0.65 ns defines the underestimation made for this biological example (17%). The pointed line at 30% of underestimation defines a range of τF lifetimes from 0.5 ns to 1.9 ns; in this range mfD happens to be very close to fD. (B) Comparison between fD and mfD for a single-lifetime donor system in vitro. Mean lifetime measurements of solutions of AO and Rd with different fractions (from 0 to 1 with an increment of 0.1) were carried out under the TriM-FLIM system at 850 nm excitation and 535AF45 emission filter. fD (solid dots) and mfD (open dots) were calculated using Eq. 5 (with τD = 3.47 ns and τF = 2.25 ns) and Eq. 6 (with τD = 3.47 ns), respectively, and plotted versus theoretical fD. The black straight line represents the theoretical value of AO percentage whereas the dashed line stands for the theoretical mfD curve (see text for calculation details). (C) Theoretical mfD and EfD behavior all over the fD range for an interval of transfer efficiency from 0.2 to 0.8 (see text for calculation details). The range of indetermination of mfD (region between the solid lines) for a given fD is narrower than the one corresponding to EfD (region between the dashed lines).

