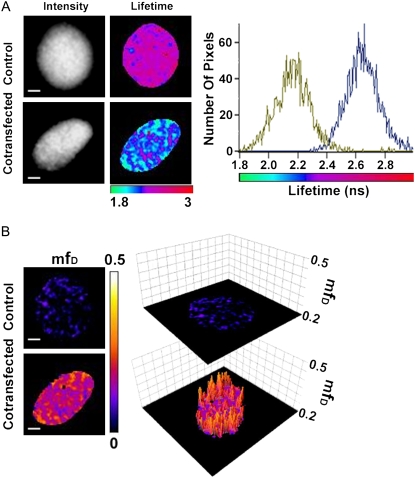
FIGURE 8.
FLIM and mfD images of CFP-BD interaction with acetylated YFP-H4 in the nucleus of HEK293 live cells using TriM-FLIM system. (A) Intensity and FLIM images of CFP-BD expressed alone as control (upper panel) or with mCherry-H4 as cotransfection (lower panel) in HEK293 live cells using the TriM-FLIM system at 800 nm excitation and 480AF30 emission filter with 11 time-gated images. Intensity images were obtained by summing the time-gated stack. FLIM images were obtained by using Eq. 2 in a pixel-by-pixel manner. The corresponding lifetime histograms are presented in the right panel (blue for control and green for cotransfection). The mean lifetime averaged throughout the nucleus decreased from 2.64 ns for the control to 2.20 ns for the cotransfection. Scale bar = 2 μm. (B) (Left panel) mfD images of control and cotransfection obtained by using Eq. 15 with 〈τ〉D = 2.64 ns. (Right panel) Three-dimensional representation of the corresponding mfD images using a threshold limit given by the control (0.2). Scale bar = 2 μm.

