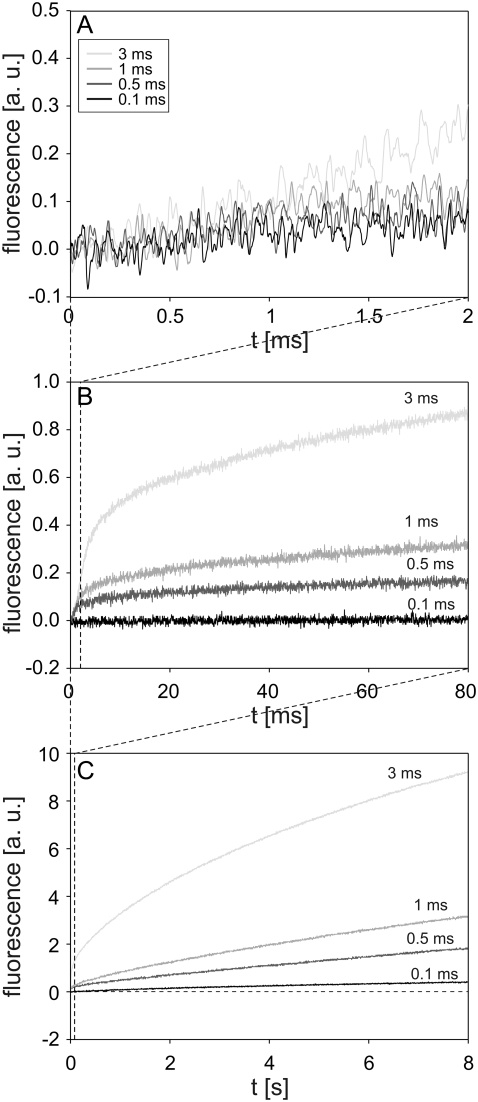
FIGURE 6.
Influence of pulse duration on the time course of fluorescence during and after electropermeabilization. The changes in fluorescence were monitored on a (A) 2 ms, (B) 80 ms, and (C) 8 s acquisition interval. CHO cells in suspension containing 100 μM of PI were exposed to a single rectangular 500 V pulse with durations of 0.1, 0.5, 1, and 3 ms. Results in different acquisition intervals were obtained from different experiments. The dashed line in C is the baseline. The background fluorescence was subtracted by the differential acquisition of the signal. Note different scale on y axes.

