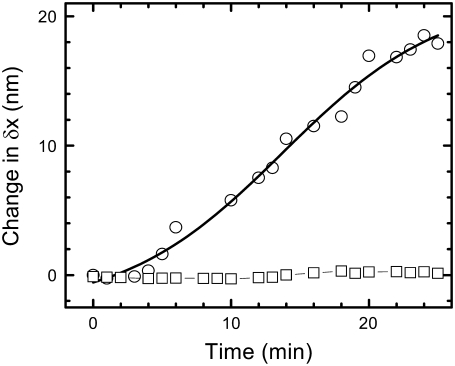
FIGURE 5.
Softening of the nucleus measured using an optically trapped bead adhered onto the nucleus stuck to a PDL-coated coverslip. In an optical trap measurement, the width of position histograms of the bead fluctuations about the trap center is plotted as a function of time for trypsin digestion (concentration ∼4 mU in a sample volume of 100 μL) of untreated (circles) and glutaraldehyde-fixed (squares, 1% for 15′) nuclei. The trap stiffness in all cases was ∼10−5 N/m, and the position time series was acquired at a sampling rate of 5000 Hz.

