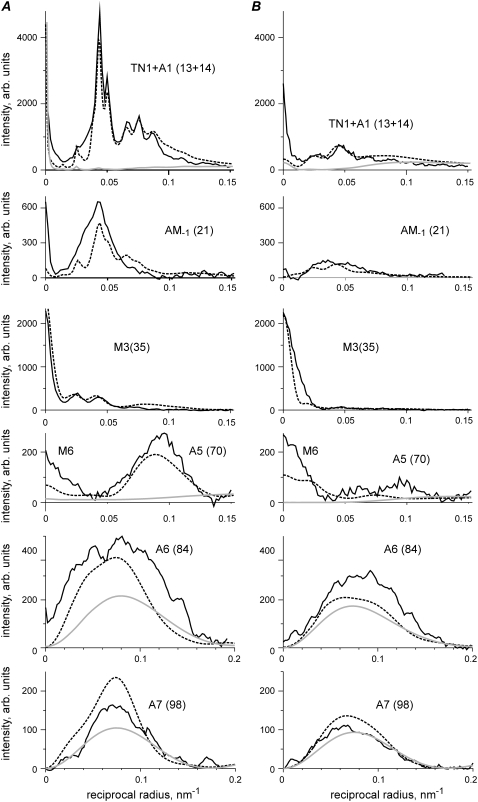
FIGURE 3.
Comparison of experimental (solid lines) and calculated (dashed lines) layer line intensities in rigor (A) and during active contraction at ∼30°C (B) for the same experimental data set as in Fig. 2. Layer lines are labeled on the corresponding panels. Numbers in brackets show the indices of the calculated layer lines in a 500.5 nm long unit cell. As the patterns were collected from a single muscle fiber and normalized for the x-ray exposure in each state, the intensities of different reflections in rigor and during active contraction can be compared quantitatively. Calculations were made for the following parameter sets: (A) e = 0.25, f(S) =1, dmax = 2 nm, ΔrA = 2 nm, ΔzA = 2 nm, ΔrT = 3.5 nm, ΔzT = 6 nm, Ψax = 0, Ψaz = 0, rigor configuration; (B) e = 0.5, f(S) = 0.4, dmax = 4 nm, ΔrA = 3.5 nm, ΔzA = 1.5 nm, Ψax = 0, Ψaz = -10°, prepower stroke configuration. Gray lines show the calculated intensities of actin layer lines in the relaxed state, f(S) = f(N) = 0; no bound heads. Both calculated diffraction patterns were multiplied for the same scaling factor λ = 0.56 providing a minimal R-factor of 0.099.

