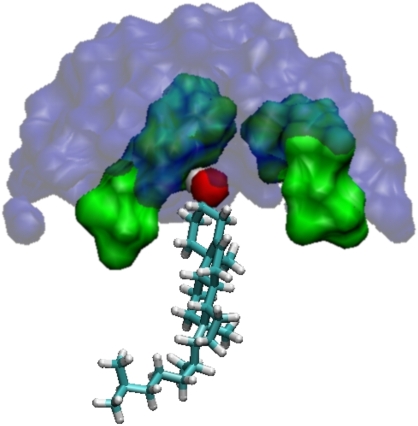
FIGURE 11.
A snapshot from the diC14:1PC + cholesterol simulation. The cholesterol molecule is covered by the headgroups of its two neighboring lipids, thus avoiding contact with water molecules. The cholesterol hydroxyl is shown as a red sphere. Surface representations of the lipid headgroups are shown in green. Lipid chains are removed for clarity. Water molecules within 11 Å of the cholesterol hydroxyl are shown in blue.

