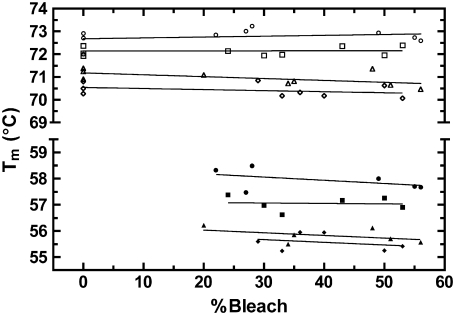
FIGURE 3.
Dependence of the rhodopsin and opsin temperature of thermal denaturation on bleaching and scan rate. The Tm of each rhodopsin (open symbols) and opsin (solid symbols) endotherms was recorded from the thermograms of ∼0–60% bleached native disk membranes at 1.5 (circles), 1.0 (squares), 0.5 (triangles), and 0.25°/min (diamonds) scan rates. Linear regression analysis produced slopes that did not significantly deviate from zero at the 95% (rhodopsin) and 90% (opsin) confidence levels.

