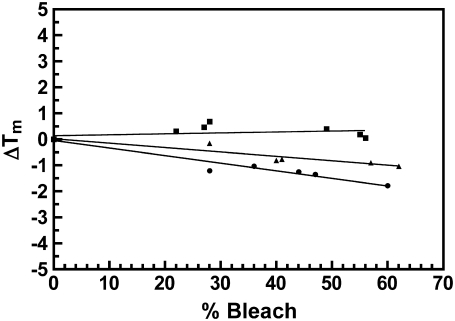
FIGURE 7.
Change in Tm as a function of percent bleach for rhodopsin in native disk membranes (squares), 16% dimeric rhodopsin in cross-linked disk membranes (triangles), and 34% dimeric rhodopsin in cross-linked disk membranes (circles). The change in Tm was calculated relative to the average Tm of at least three scans of unbleached disk membranes (Tmavg = 72.5 ± 0.5, 71.8 ± 0.1, and 72.9 ± 0.3, respectively). Differences in the Tmavg represent variability between disk membrane and cross-linking preparations. The Tm of each respective endotherm was recorded from excess heat capacity curves of ∼0–60% bleached disk membranes at a 1.5°/min scan rate. Linear regression analysis produced slopes that significantly deviated from zero for the cross-linked disk membranes (>99.9% confidence level).

