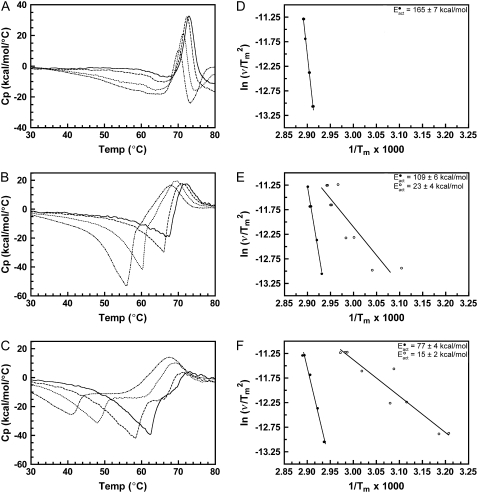
FIGURE 8.
Determination of the Eact of denaturation for native and cross-linked rhodopsin in disk membranes. Representative thermograms and plots of ln( ) versus 1/Tm for (A and D) unbleached native disk membranes, (B and E) 16% dimeric rhodopsin in cross-linked disk membranes, and (C and F) 34% dimeric rhodopsin in cross-linked disk membranes. The thermograms were acquired at scan rates of 1.5°/min (solid curves), 1.0°/min (dashed curves), 0.5°/min (dotted curves), and 0.25°/min (dashed-dot-dashed curves). The scan rates and Tms of each endothermic (solid circles) and exothermic (open circles, for the cross-linked samples only) transition were used for the modified Arrhenius plots. At least two Tm values for each transition were used. The Eacts for the transitions were determined from the slope of each ln(
 ) versus 1/Tm plot according to the equation ln(
 ) = const. − Eact/R(1/Tm) (20,24) (see Materials and Methods). Lines are best fit as determined by linear regression.

