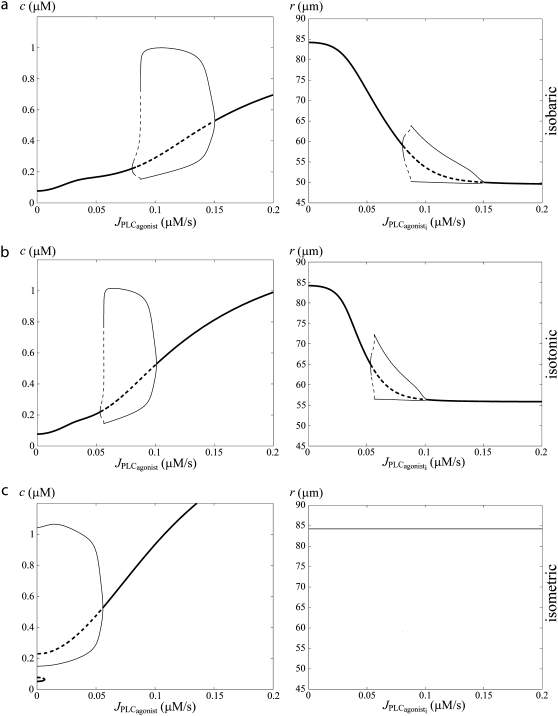
FIGURE 1.
Bifurcation diagrams of the calcium concentration c (left column) and the vessel radius (right column) with respect to the agonist-activated PLC-rate,  (Thick solid line) Stable rest state; (thick dashed line) unstable rest state; (thin solid line) minima and maxima of stable oscillations; and (thin dashed line) minima and maxima of unstable oscillations. (a) Isobaric case (the constant pressure p = 80 mmHg corresponds to that of the isometric and isobaric cases at
  ). (b) Isotonic case (the constant tension T = pr corresponds to that of the isometric and isobaric cases at
  ). (c) Isometric case (the constant radius r = 84.225 μm corresponds to that of the isobaric and isotonic cases at
  ).
).

