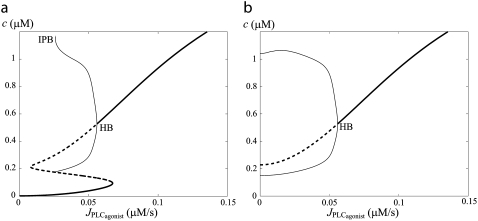
FIGURE 2.
Bifurcation diagrams of the calcium concentration c with respect to the agonist-activated PLC-rate,  in isometric conditions. (Thick solid line) Stable rest state; (thick dashed line) unstable rest state; (thin solid line) minima and maxima of stable oscillations; (thin dashed line) minima and maxima of unstable oscillations; (HB) Hopf bifurcation; and (IPB) infinite period bifurcation. (a) r = 77.205 μm. (b) r = 86 μm.

